Quick answer
One meet is noise. Compare Seasons lines this short course or long course season against last year so you see the trend. Sign in to Gophin (free). Official times load. You do not type them in.
Rafa came home from a meet in Vancouver last spring with a frown. She had just dropped two seconds in her 200 free, but she was upset because her 100 was a tenth slower than the week before. She kept staring at the two times like they meant her whole season was off.
I get it. When you only look at your last race, the picture is too small. One bad swim feels like a step backwards. One good swim feels like everything is finally clicking. Neither is the full story.
The full story lives in the season. Three months of training. Twelve to twenty races. A handful of taper meets. That is the unit of progress in swimming, not a single event on a single Saturday.
This is exactly what Compare Seasons inside Gophin is built for. Here is how to use it, what to look for, and why pulling back to the season view changes how you talk about progress.
Why Looking at Single Times Is Misleading
Every race carries noise. Pool temperature, lane assignment, how you slept, what you ate, whether you tapered, whether you raced the day before. A 100 free time is the swim, plus all of that.
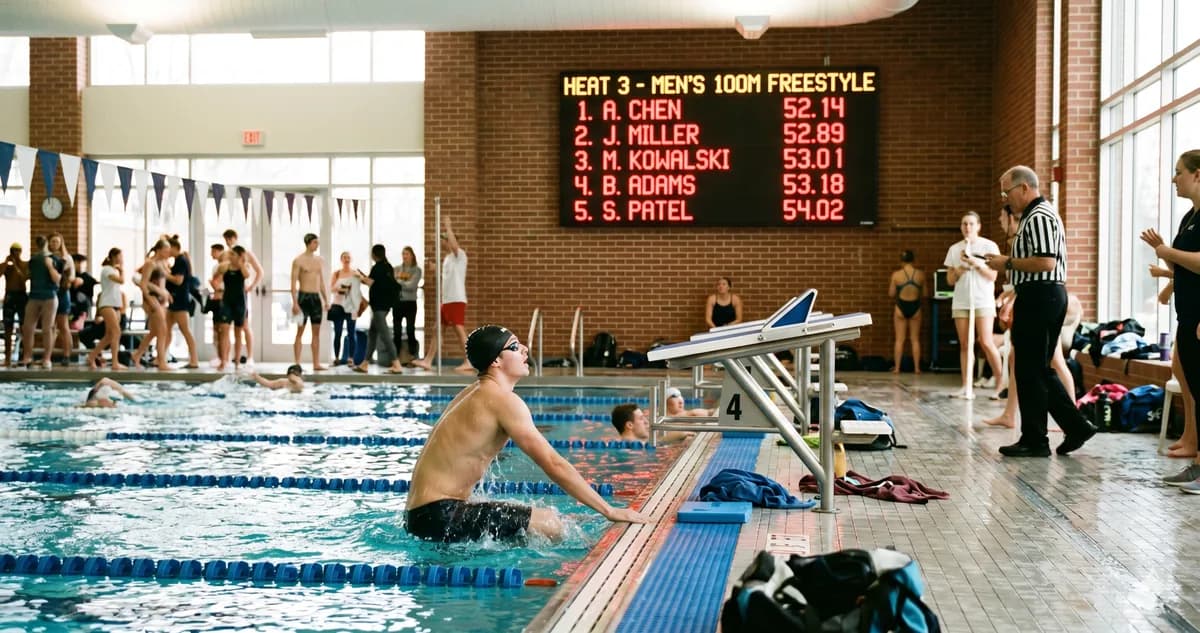
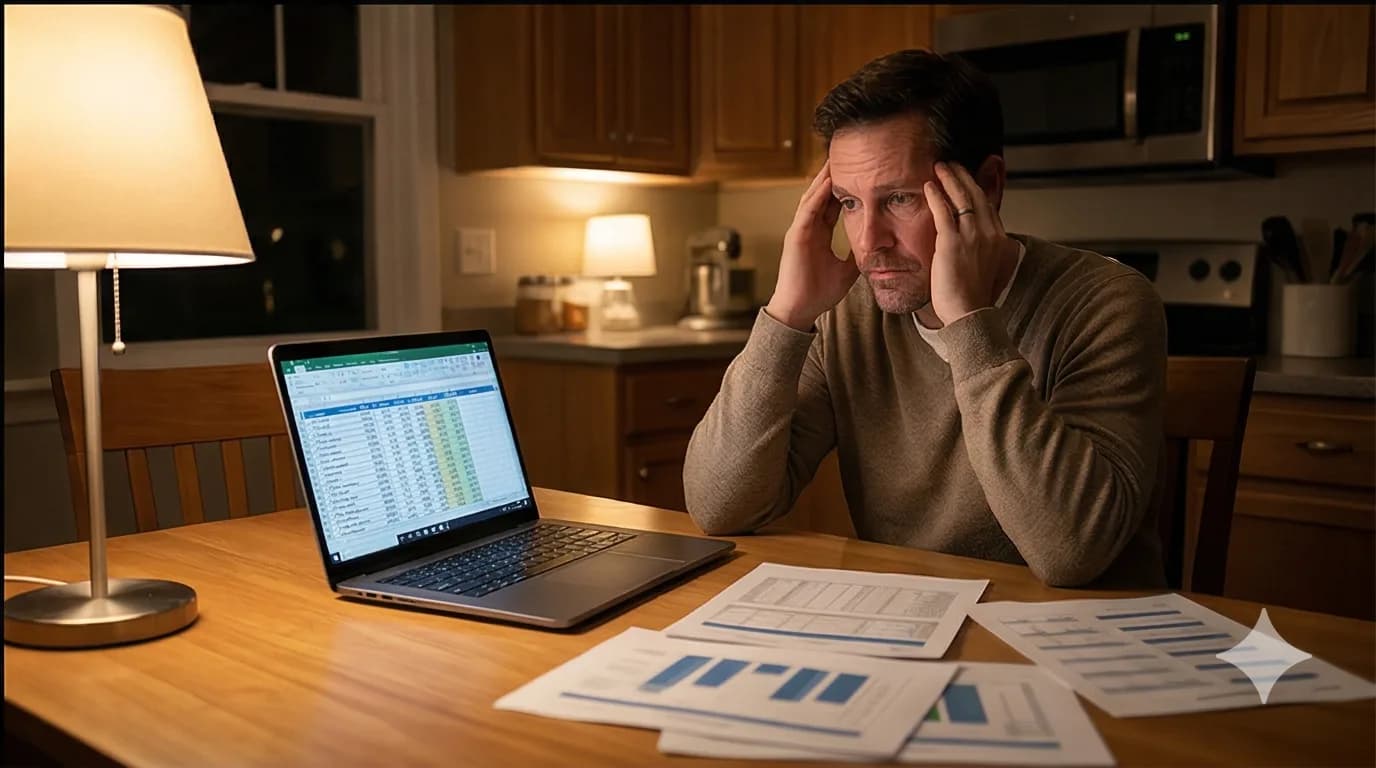
Compare two single times from two different meets and you are comparing two clouds of variables, not two performances. That is why a swimmer can post a personal best in October, swim three slower times through November, and still be improving. The trend is up. The individual races just look noisy.
When you zoom out to a full season, the noise averages out. You start to see the actual line: are you trending faster, holding steady, or slipping?
That is the question that matters, and it is the question single-meet times cannot answer.
What Compare Seasons Actually Shows You
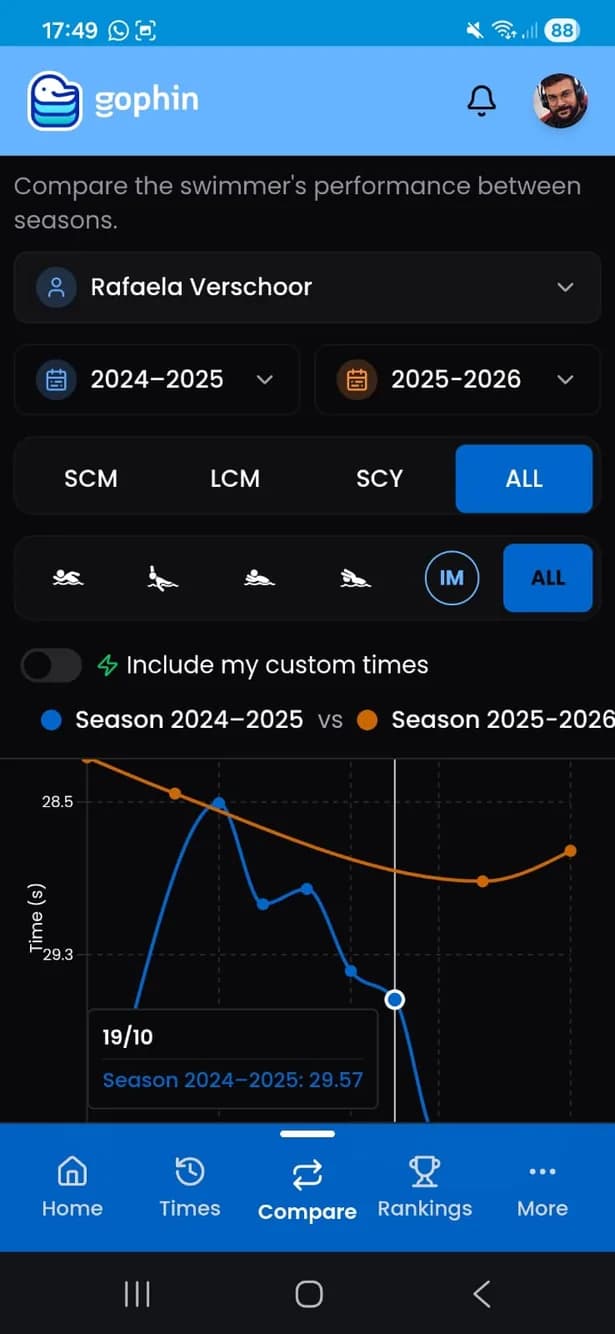
Compare Seasons in Gophin lets you put two or three full competitive seasons side by side for the same event. You pick the event (say, 100 freestyle, short course meters), pick the seasons you want to compare, and the app overlays them on the same chart.
What you see:
- Every race in each season plotted as a point on a timeline
- A color-coded line for each season so you can tell them apart at a glance
- Your �0� highlighted for each year
- The shape of the season: when you peaked, when you dropped, where you held a plateau
It is one chart. But it is the difference between "I had a good race in March" and "I dropped two seconds across the season and peaked at championships, same as last year, just two seconds faster."
That second sentence is what coaches and college recruiters want to hear. It is also what gives swimmers confidence going into next season.
How to Read the Comparison Chart
When you open Compare Seasons for the first time, the chart can feel busy. Here is how to read it without getting lost.
Look at the season-best points first. Each season has a highlighted best time. If this season's best is faster than last season's best, that is real improvement, regardless of how the in-between races look.
Then look at the shape. Does each season start slow and finish fast? That is normal taper-and-peak shape. If this season is shaped differently (peaks earlier, has a bigger mid-season dip, plateaus longer), that tells you something about training, recovery, or scheduling.
Watch the gaps between dots. Long gaps mean fewer races. If you raced eight times last season and only four this season, your data is thinner and noisier. More races, more signal.
Compare same-meet results when possible. If you raced the same December invite two years in a row, compare those two specific dots. Same pool, same time of year, same point in the training cycle. That is the cleanest apples-to-apples you will get.
The chart is a tool, not a verdict. It shows the pattern. You decide what it means in the context of your training.
Best Use Cases for Compare Seasons
Compare Seasons earns its keep in a few specific moments. These are the ones that come up most.
Pre-meet planning. Two weeks out from a championship meet, pull up Compare Seasons for the events you are racing. Where were you at this point last year? What did you finish at? That gives you a realistic target, not a wishful one.
End-of-season recap. When the season closes, review every event in Compare Seasons. Which events improved most? Which ones flattened? That conversation, with a coach or on your own, is how you set goals for next season.
Spotting plateaus. If your season best for 200 free has not moved in three seasons, the chart will show it immediately. Three flat lines stacked on top of each other. That is a signal to look at training, not just race more.
Confirming a breakthrough. Sometimes you feel like you had a great season, but it is hard to be sure. Compare Seasons confirms it (or doesn't) with the actual numbers.
Recruiting conversations. College coaches want to see trajectory, not just one fast race. A clean three-season comparison chart tells your story in five seconds.
What Compare Seasons Does Not Do
It does not replace your coach. It does not tell you why a season went the way it did. It does not factor in growth spurts, school stress, injuries, or training changes.
It also does not predict the future. A flat season can be followed by a breakthrough. A great season can be followed by a tough one. The chart shows you the past clearly. The next season is still up to you.
What it does do is replace guessing with seeing. Most swimmers carry a vague sense of "I think I improved this year." Compare Seasons replaces the vague sense with a clear picture.
Compare Seasons Is Free for Everyone
Gophin covers Best Times, Meets, Records, Standards reference, and Rankings, which gives swimmers and parents a strong base to track results.
Compare Seasons (along with Compare Swimmers, Compare Standards, full Rankings, and access to all 38+ standards organizations) is included for everyone, free.
Every feature is free for everyone, including the comparison tools, full standards reference, and complete rankings access.
If your swimmer is at the point where season-over-season analysis is part of how they plan training and meets, Compare Seasons makes that clearer goal-setting effortless.
Open Gophin free and start comparing your seasons in under a minute.
One Last Thing
A single race tells you about a single race. A season tells you about a swimmer.
If you have spent the year staring at one fast time or one disappointing one, pull back. Look at the whole season. Then put it next to last season. The story is almost always different from what you thought.
See your seasons side by side with Gophin, free for everyone.
Sources
- World Aquatics. Competition Regulations, February 2026 update. Definitions of competitive seasons and short course / long course calendars. worldaquatics.com
- USA Swimming. Time Standards and Athlete Development resources. Definitions of personal best and season best in competitive swimming. usaswimming.org
- Swimming Canada. Competition pathway and seasonal structure. swimming.ca